Facts and Figures 2004-2005
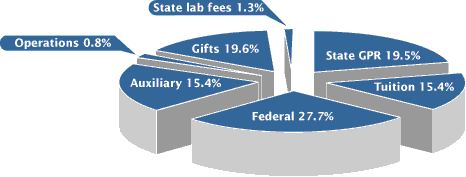
2004–05 Revenue (by source)
|
Source
|
Support
($ in millions)
|
% Change from
previous year
|
|
State general purpose revenue
|
|
General program appropriations
|
259.6
|
-3.7
|
|
Specific purpose
|
110.1
|
-0.7
|
|
Total state revenue
|
369.7
|
-2.8
|
|
Student tuition revenue
|
297.0
|
8.4
|
|
Federal programs and projects
|
526.3
|
8.8
|
|
Gifts, grants, and segregated funds
|
372.5
|
6.9
|
|
State laboratory fees
|
23.9
|
0
|
|
Auxiliary enterprises
|
292.7
|
3.4
|
|
Operations receipts
|
15.8
|
11.5
|
|
Total
|
1,897.9
|
5.0
|

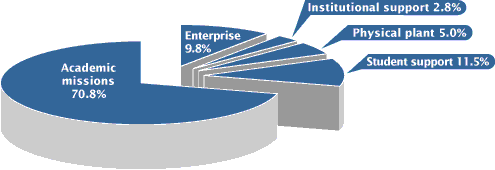
2004–05 Budget Allocation (by program)
|
Source
|
Support
($ in millions)
|
% Change from
Previous Year
|
|
Source: Office of Budget, Planning and Analysis
|
|
Academic missions
|
|
Instruction
|
398.3
|
6.6
|
|
Research
|
733.3
|
2.7
|
|
Public service
|
37.3
|
21.9
|
|
Academic support
|
133.2
|
9.7
|
|
Academic debt service
|
42.4
|
0.5
|
|
Total academic missions
|
1,344.5
|
4.9
|
|
Student support
|
|
Student services
|
128.3
|
6.4
|
|
Financial aid
|
90.4
|
21.9
|
|
Total student support
|
218.7
|
12.3
|
|
Physical plant
|
94.3
|
4.2
|
|
Institutional support
|
53.7
|
9.4
|
|
Enterprise operations
|
|
Farm operations
|
9.9
|
3.9
|
|
Auxiliary enterprises
|
95.0
|
-5.5
|
|
State laboratories
|
36.8
|
0.5
|
|
Hospitals
|
45.1
|
0.1
|
|
Total enterprise operations
|
186.1
|
-2.5
|
|
Total
|
1,897.9
|
5.0
|

Trends
1995-2005 Revenue Sources
($ in millions)
|
Fiscal Year
|
State Support
|
Federal Projects
|
Tuition Revenue
|
Gifts and Grants
|
Total Budget
|
|
1995–96
|
327.4
|
305.2
|
156.6
|
177.2
|
1,129.3
|
|
1996–97
|
329.3
|
310.5
|
160.8
|
220.3
|
1,206.7
|
|
1997–98
|
337.3
|
305.3
|
173.5
|
225.6
|
1,252.0
|
|
1998–99
|
350.7
|
315.0
|
175.1
|
221.1
|
1,291.0
|
|
1999–00
|
366.7
|
347.4
|
194.9
|
250.6
|
1,406.4
|
|
2000–01
|
399.3
|
367.4
|
207.0
|
270.8
|
1,511.7
|
|
2001–02
|
408.3
|
397.1
|
225.3
|
297.2
|
1,614.7
|
|
2002–03
|
399.1
|
417.4
|
250.2
|
323.4
|
1,696.1
|
|
2003–04
|
380.4
|
483.7
|
273.9
|
348.3
|
1,807.7
|
|
2004–05
|
369.7
|
526.3
|
297.0
|
372.5
|
1,897.9
|
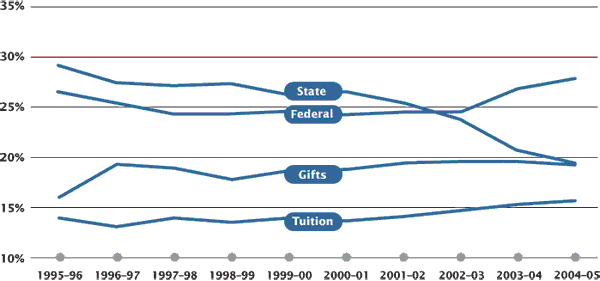
1995-2005 Revenue Sources
(as a percentage of budget)

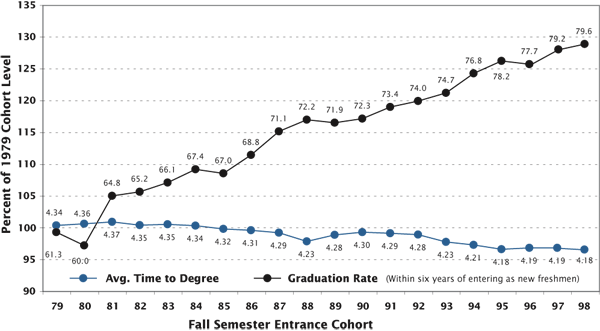
Average Time to Degree and Graduation Rates


