Fourth-Year Progress Report
Provide an exemplary undergraduate experience
Rankings released during the academic year demonstrated UW–Madison’s academic excellence and value. The UW tied for 10th among public institutions in U.S. News and World Report’ s 2013 edition of Best Colleges. Princeton Review ranked it seventh among the nation’s best values in higher education at public institutions, while Kiplinger’s ranked it 13th on its 2013 list of 100 best values in public education. A scorecard from the U.S. Department of Education reinforced UW–Madison’s standing as a good value among its peers.
In fall 2012, the freshman class was the largest ever, with 6,279 students, and it had the largest number of new students from Wisconsin — 3,515 — since 2005. Fourteen percent were students of color and 17 percent were first-generation college students.
The UW System Board of Regents recognized First-Year Interest Groups (FIGs) — UW–Madison’s program designed to help freshmen make the transition to college academically and socially — with a Teaching Excellence Award.
The Wisconsin Collaboratory for Enhanced Learning (WisCEL), one of the success stories of the Madison Initiative for Undergraduates, combines formal instruction with more informal learning. Students in WisCEL sections of pre-calculus-level math and engineering courses, for example, consistently earned higher grades than students in the non-WisCEL sections of the same courses.
Radioactive, a book about Marie and Pierre Curie written and illustrated by Lauren Redniss, was selected for the fourth year of Go Big Read, UW–Madison’s common-reading program. New students received copies during Wisconsin Welcome and more than 90 courses used the book.
Student creativity, achievements and research were front and center during the 15th Annual Undergraduate Symposium, one of many events held during Ideas to Excellence, a month-long celebration that showcased scholarly and artistic accomplishments. Symposium participation was the most robust ever, with 549 undergraduates sharing their work.
Reflecting that UW student-athletes are students first and athletes second, 225 were named Academic All-Big Ten honorees, 296 were named to the Dean’s List or Dean’s Honor List, and the cumulative GPA for all student-athletes at the end of 2012–13 was 3.0.
Supporting charts
Note: If you are unable to read the charts below, please contact the Office of Quality Improvement. Staff there will help explain the content of any chart in this progress report.
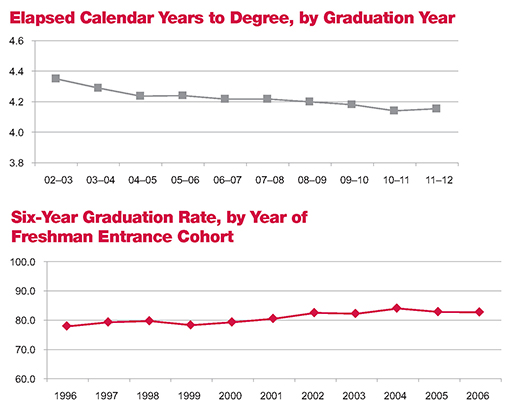
Trend in Average Time to Degree and Graduation Rates
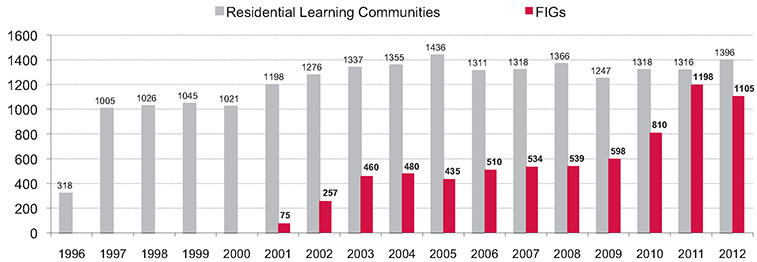
Residential Learning Communities and First-Year Interest Groups (FIGs)
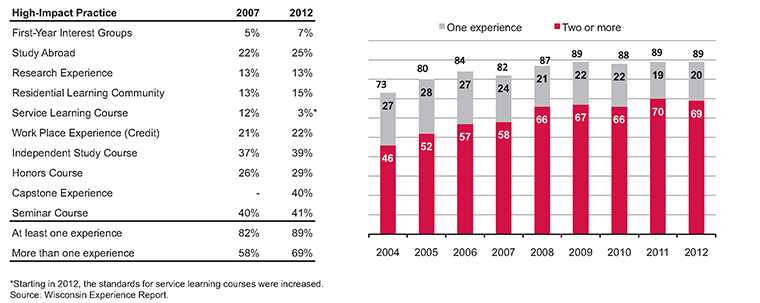
Participation Rate in Wisconsin Experience Activities for
Bachelor's Degree Recipients