Second-Year Progress Report
Priority: Provide an exemplary undergraduate experience
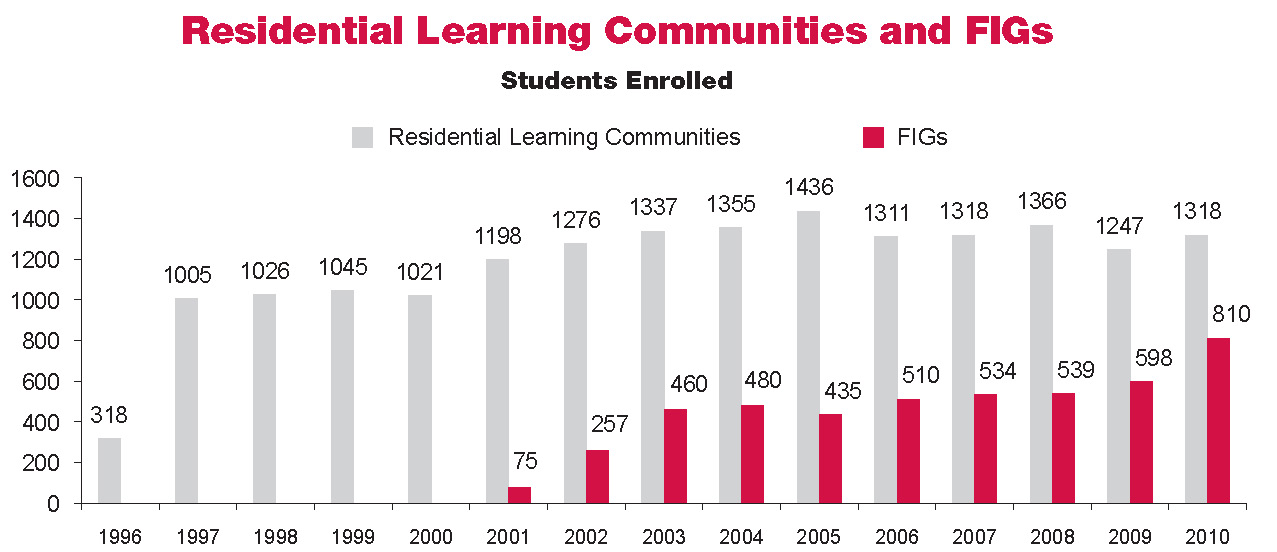
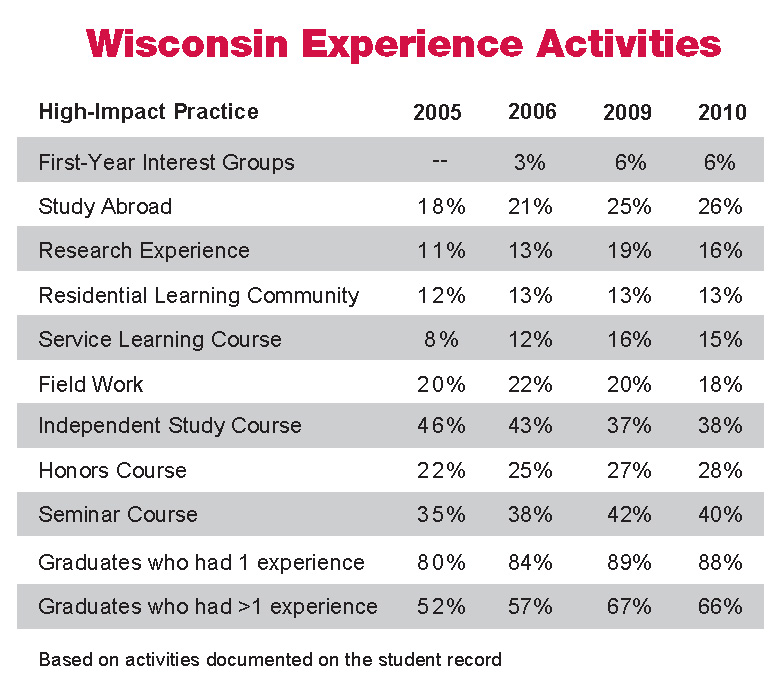
- The Wisconsin Experience provides students with high-impact practices, including service learning, research experiences, and study abroad.
- An increase in need-based aid and merit-based scholarship funding allowed us to offer financial aid and scholarships earlier in the recruitment process to attract targeted students (such as low-income, first-generation, women in STEM fields, underrepresented minorities, students from rural areas, and Wisconsin high-achievers).
- Great People Scholarships, which provide need-based financial support, were awarded to 69 students in the first year. Thanks to philanthropic gifts of more than $25 million and university matching funds, at least 500 students will receive such scholarships in 2011–12.
- New and transfer students are receiving enhanced academic support through the Center for the First-Year Experience.
- “Reverse articulation” agreements are being explored, allowing an increase in associate degrees awarded to transfer students from Madison College.
- The Go Big Read program engaged students and faculty across campus in discussing the many complex issues presented in The Immortal Life of Henrietta Lacks. The book was used in the curriculum for 88 timetable courses across campus and for 45 book discussions held at all four schools in the health sciences.
- UW student-athletes carried a cumulative 3.04 grade point average, and 244 UW student-athletes appeared on the Dean’s List.
- The Chemistry 103 project was among innovative efforts to reduce the achievement gap for gateway courses.
- The Parent Program helped 24,000 parents connect to campus and serve as important partners in student success.
Supporting charts
Note: If you are unable to read the charts below, please contact the Office of Quality Improvement. Staff there will help explain the content of any chart in this progress report.