Third-Year Progress Report
Recruit and retain the best faculty and staff, and reward merit. Enhance diversity to ensure excellence in education and research.
The university is using new tools to dig deeper into the academic pipeline to identify, interview, and compete for prospective faculty members who enhance excellence and diversity.
A targeted critical compensation fund has been created to reward and retain valuable faculty and staff whose salaries have lagged behind market or equity baselines.
In fall 2011, low-income students accounted for 16.9 percent of the total undergraduate enrollment. Among Wisconsin resident undergraduates, 20.8 percent were low-income students.
More than 8,500 undergraduates received need-based grants totaling more than $26 million in 2011–12. Because of dedicated need-based and merit-based funds, the university could offer financial aid and scholarships earlier in the recruitment process to attract targeted populations such as first-generation and rural students; women in STEM fields; underrepresented minorities; and Wisconsin high-achievers. A portion of these funds were awarded as scholarships provided through the Great People Scholarship program, which to date has received more than $25 million in gifts and university matching funds. These scholarships were awarded to more than 520 students during 2011–12, and more than 600 students will receive the scholarships in 2012–13.
As part of an initiative sponsored by the White House, UW–Madison promoted interfaith, community service, and social justice efforts, enhancing educational experiences for students and fostering an understanding of people of different religious backgrounds.
The Division of Diversity and Campus Climate has raised more than $1 million during the last 12 months, fostering new grant and other entrepreneurial initiatives designed to create resources to develop targeted ACT preparatory efforts.
The Chancellor’s Scholarship Program and the Powers-Knapp Scholarship Program are designed to help the university attract and develop academically outstanding individuals from underrepresented minority groups. In fall 2012, 57 chancellor's scholars enrolled, bringing the total on campus to 222. Powers-Knapp scholars on campus total 252, including 58 students who enrolled in fall 2012.
Supporting charts
Note: If you are unable to read the charts below, please contact the Office of Quality Improvement. Staff there will help explain the content of any chart in this progress report.
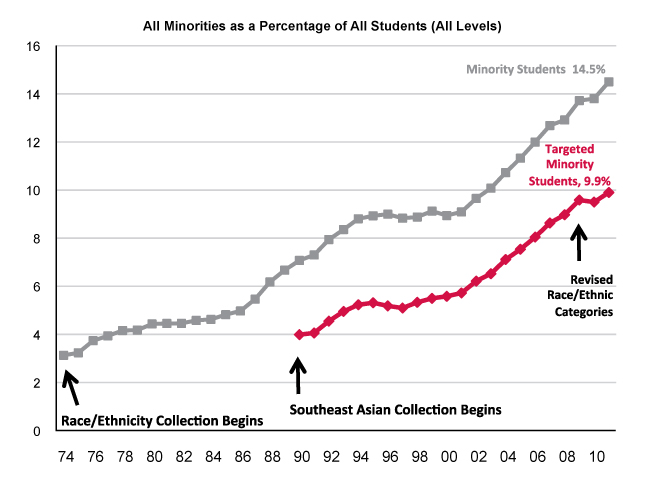
Diversity Categories (Percent of Fall Enrollment)

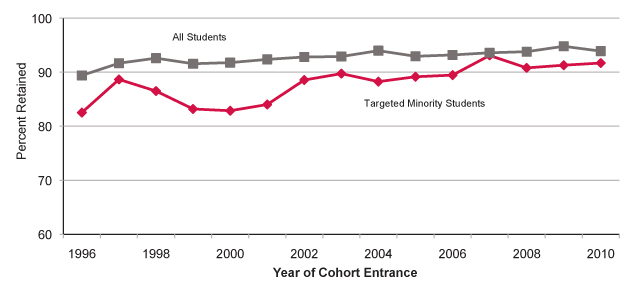
Student Retention Rates (Percent Retained to the Second Year)
