Fifth-Year Progress Report
Recruit and retain the best faculty and staff, and reward merit. Enhance diversity to ensure excellence in education and research.
- Chancellor Rebecca Blank participated in a White House conference of university presidents who discussed college accessibility and student success. Among the commitments UW–Madison is making is an expansion of college pipeline programs, such as PEOPLE (Pre-College Enrichment Opportunity Program for Learning Excellence), which operates in lower-income areas in Wisconsin and currently involves nearly 900 pre-college students and 350 matriculated college students.
- PEOPLE was the recipient of the sixth annual Regents’ Diversity Award for team excellence, presented by the UW System Board of Regents. The program has achieved outcomes that include a 95 percent enrollment rate into institutions of higher education for pre-college program participants and an average six-year graduate rate of 68 percent for the past five years for those who enrolled at UW–Madison.
- The Information Technology Academy, sponsored by the Division of Information Technology, launched a unique partnership with the Oneida Tribe of Indians of Wisconsin and the Lac du Flambeau Band of Lake Superior Chippewa Indians. The program provides pre-college technology access and training for Native American high school students.
- UW–Madison’s Ad Hoc Diversity Planning Committee engaged the campus and the community in developing “Forward Together: A Framework for Diversity and Inclusive Excellence,” completed in May. The report, a successor to initiatives including Plan 2008, is intended to help members of the campus community contribute to making UW–Madison more equitable, inclusive, and diverse, both on campus and in the community. The framework addresses five targeted domains: access to UW–Madison and to resources after students and employees join the campus, inclusive climate and culture, creativity and innovation, the Wisconsin Idea, and accountability.
- The university developed a Faculty Diversity Initiative, which offers practical tools for pipeline development and effective recruitment to enhance excellence with diversity, broadly defined. Among several notable results, the community of black faculty increased 20 percent between 2009 and 2013, and the increase will continue in 2014.
- For the second year, funding was reallocated to a Critical Compensation Fund aimed at offering targeted salary increases to faculty and staff. The program provided pay adjustments to address issues of equity with peers, job retention, and market influences.
- Workplace civility is a commitment by our campus and is being actively advanced by two campus initiatives. One group is addressing education and awareness, and empowering individuals to prevent destructive behaviors and intervene when appropriate. In addition, a governance group is addressing policy issues to enable corrective action to be taken when warranted.
- Shared governance opportunities grew for the nearly 5,000 classified staff employees as they elected representatives to the newly formed Classified Staff Executive Committee and began to form a Classified Staff Congress.
Supporting charts
Note: If you are unable to read the charts below, please contact the Office of Quality Improvement. Staff there will help explain the content of any chart in this progress report.
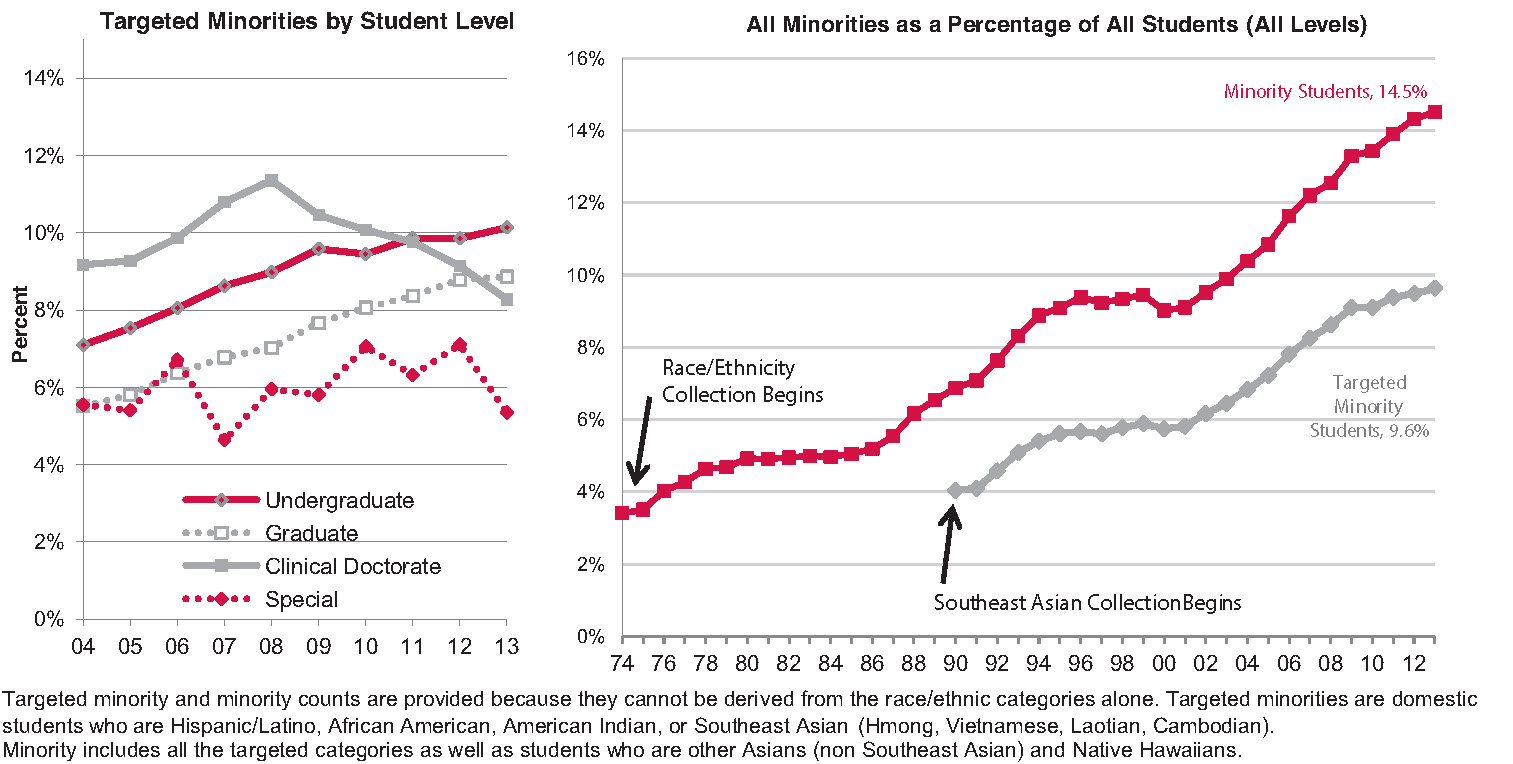
Diversity Categories (Percent of Fall Enrollment)
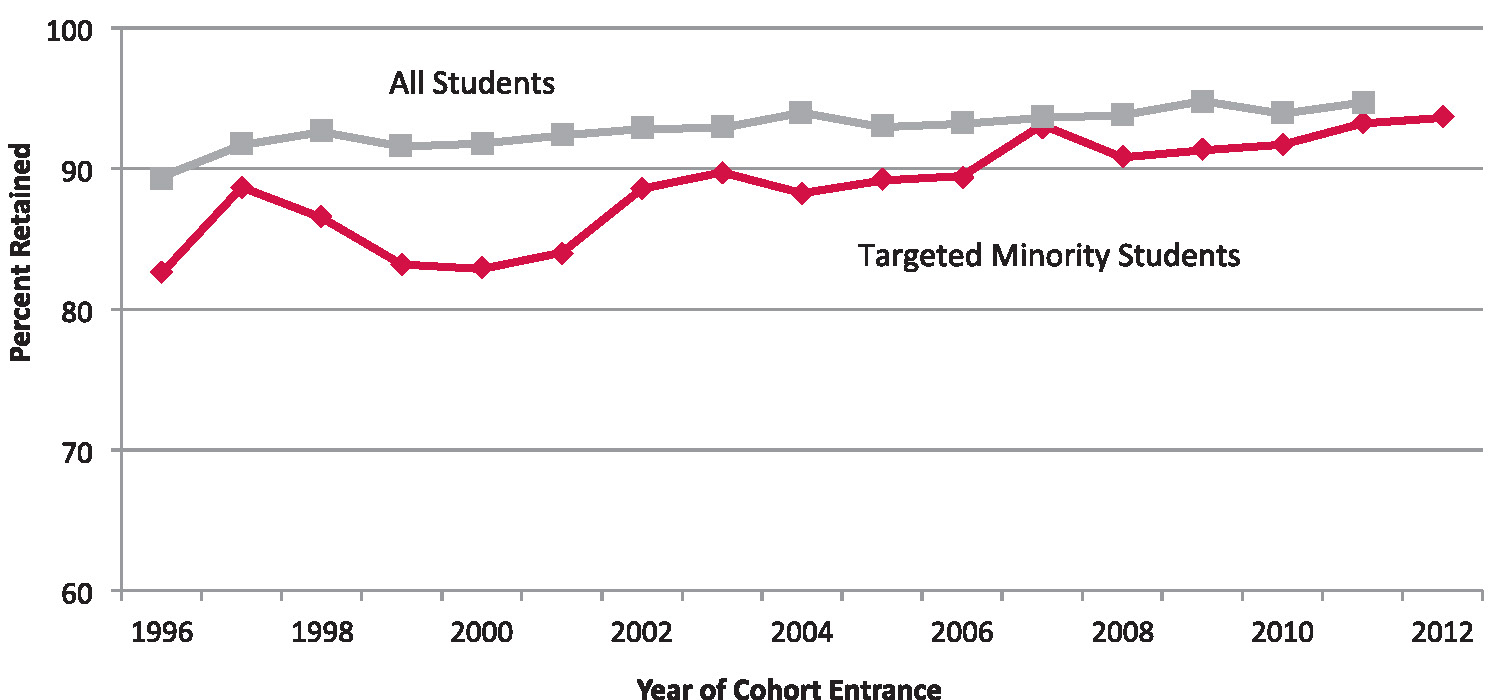
Student Retention Rates (Percent Retained to the Second Year)