Fifth-Year Progress Report
Provide an exemplary undergraduate experience
- This year’s incoming freshman class of 6,339 students was the largest ever, and it included the largest number of Wisconsin residents since 2001. Students hailed from every county in the state, from 45 states and Washington, D.C., and from 34 countries. The class was also one of the most diverse: African-American, Hispanic/Latino, American Indian, and Asian/American students made up 16.1 percent of the class, the largest percentage in the past decade.
- Now in its fourth year, the Madison Initiative for Undergraduates (MIU) has added $40 million annually to the university’s base budget to support undergraduate experiences. MIU funding created the opportunity to hire about 75 new faculty, providing increased capacity for undergraduate majors in high-demand areas; supported curricular reform, including the development of new courses; and increased liberal arts and international internships. Half of MIU funds were committed to need-based financial aid.
- Kiplinger’s Personal Finance ranked UW–Madison eighth in the nation among best values in public universities, rising from 13th place in the previous two years.
- As part of Ideas to Excellence, a month-long celebration of students’ academic and creative achievements, the 16th Annual Undergraduate Symposium gave some 600 students the chance to present their work in a professional setting. Other events ranged from an art show to an honors thesis symposium to a digital salon.
- UW–Madison ranked sixth among U.S. universities and colleges in the number of students studying abroad in 2011–12, with 2,149 students earning academic credit in 85 countries on six continents. The university ranked 22nd among peer institutions in the total number of international students hosted in 2012–13, with 5,291.
- According to federal data, student loan repayment rates for UW–Madison students are well above the national average. UW–Madison graduates had a 1.11 percent default rate on federal Perkins Loans — traditionally given to students with high financial need, far less than the national average of about 11 percent. The two-year default rate for federal Stafford loans among UW students was just 1.1 percent, compared to the national average of 10 percent.
- UW–Madison was one of only four American institutions that could boast three super-elite scholars in the same year. Students were awarded a Rhodes Scholarship, one of the top honors in higher education; a Marshall Scholarship to attend the London School of Economics; and a Churchill Scholarship to attend the University of Cambridge.
- During 2013–14, 3,288 students (65 percent of them undergraduates) enrolled in 81 courses that offered community-based learning components or opportunities.
Supporting charts
Note: If you are unable to read the charts below, please contact the Office of Quality Improvement. Staff there will help explain the content of any chart in this progress report.
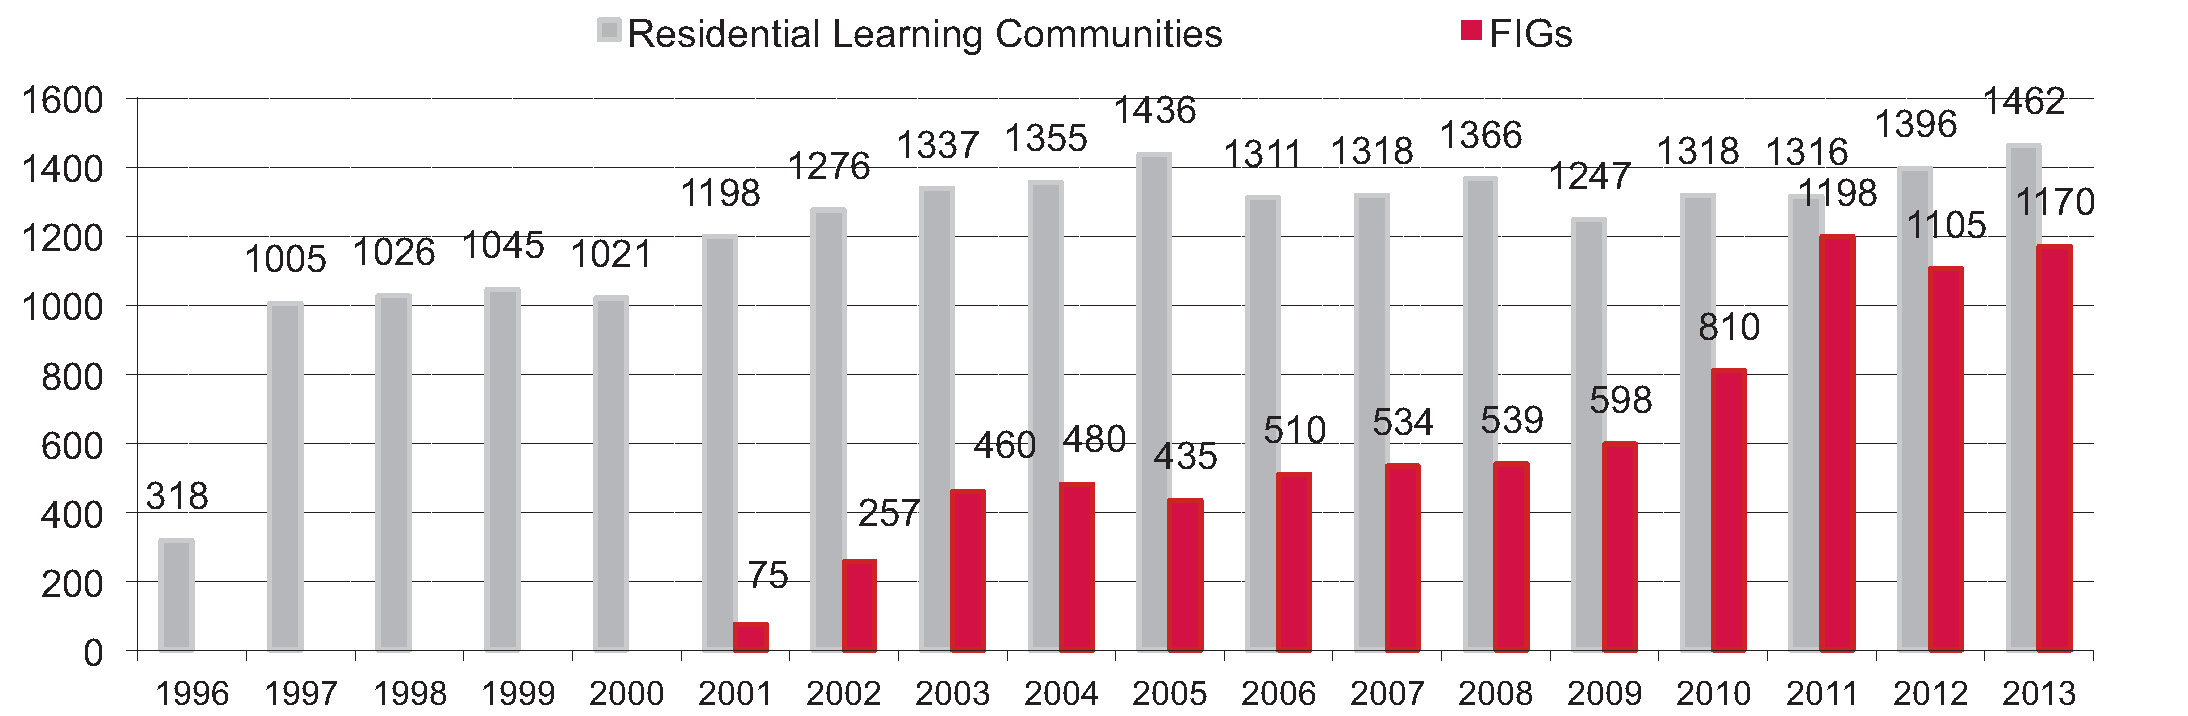
Residential Learning Communities and First-Year Interest Groups (FIGs)
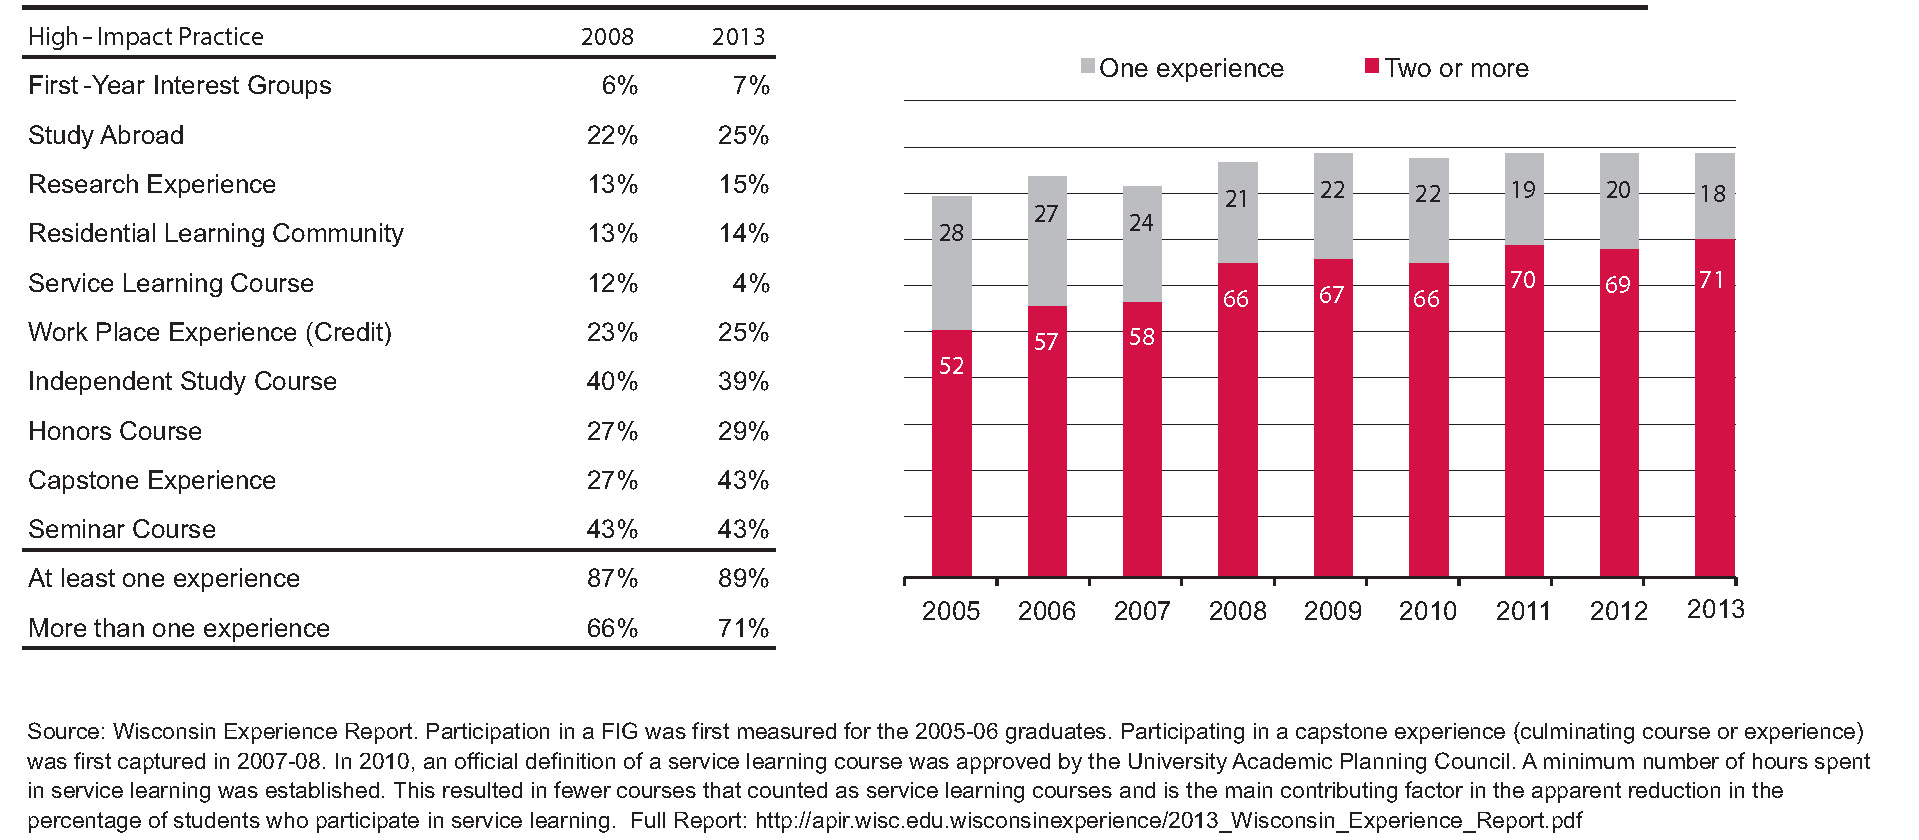
Participation Rate in Wisconsin Experience Activities for
Bachelor's Degree Recipients
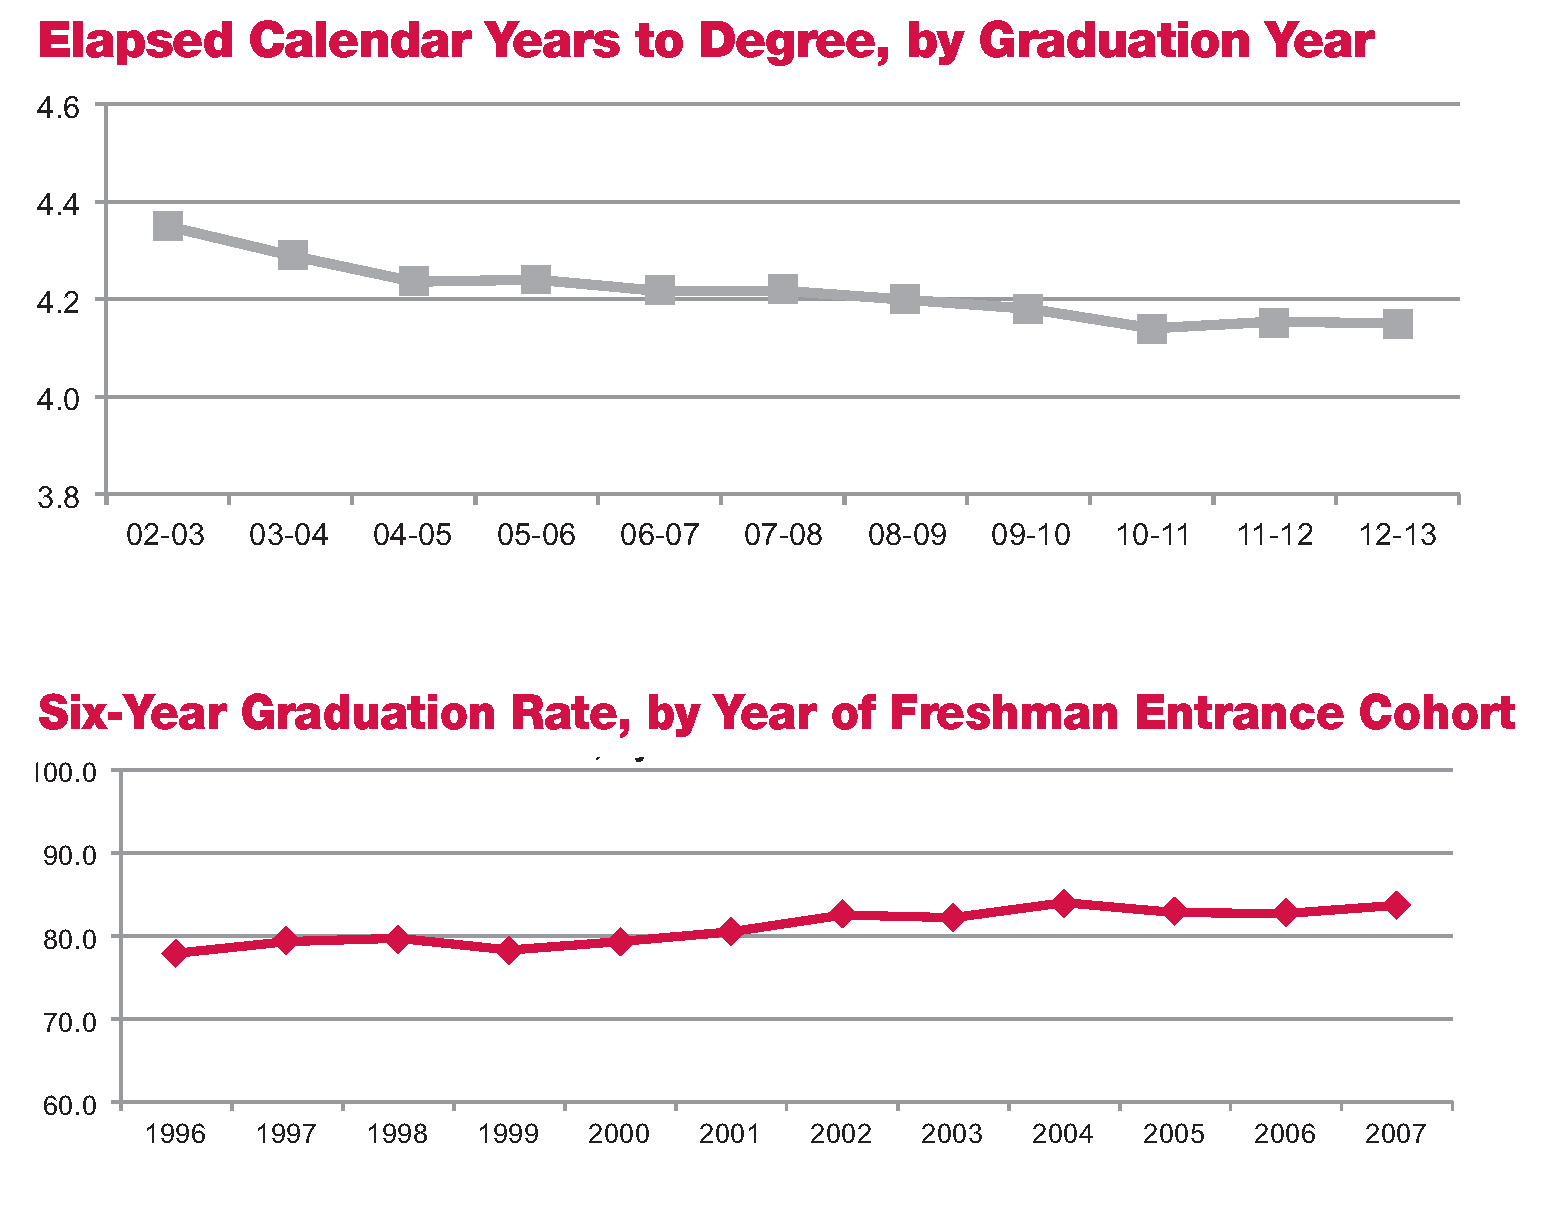
Trend in Average Time to Degree and Graduation Rates